


Don't settle for slow internet speeds and Wi-Fi dead zones in your home. The best Wi-Fi routers can give every device the connectivity boost they deserve, from blazing-fast download speeds to long range to cover every room in your house. Trust me, after years of testing the latest systems, these are well worth the investment.
Our teams of Wi-Fi experts here at Tom's Guide have done the hands-on testing to prove it, taking each router we get in and put them through extensive testing in a multi-story home. From standard Wi-Fi 7 routers to mesh Wi-Fi systems, along with valuable budget options, we run benchmarks at multiple distances and locations, including through walls, to measure both their speed and range under realistic conditions.
So, if you're ready to future-proof your home, our top recommendation right now is the bargain-worthy TP-Link Archer BE770 Wi-Fi 7 router. Not only is it affordably priced, but it also delivers excellent range in its class and multi-gigabit speeds. Looking for even more options to suit your needs and budget, whether you work from home or are a gamer? We've got them. This guide will help you find the best Wi-Fi router for your setup.
The best Wi-Fi routers you can buy today
Why you can trust Tom's Guide Our writers and editors spend hours analyzing and reviewing products, services, and apps to help find what's best for you. Find out more about how we test, analyze, and rate.
Best Wi-Fi router overall


The TP-Link Archer BE770 is the best all-around Wi-Fi router you can buy right now, thanks to its outstanding real-world speed and consistently strong performance in our tests. In hands-on testing, it delivered a wireless throughput of 2.181 Gbps at 15 feet, and that beats many of the best Wi-Fi 7 routers that cost hundreds more. Seriously, it's a clear value leader at the premium end.
What really sets the BE770 apart is its ability to fill a typical home with fast, reliable Wi-Fi. We measured its range at 130 feet, an exceptional result that means far-flung bedrooms and home offices can still enjoy solid speeds, not just those sitting near the router. In fact, our reviewer, Brian, called it “the rare router with range to match at 130 feet.”
Performance doesn’t nosedive at a distance, either. At 50 feet from the router, the BE770 maintained an impressive 1.239 Gbps, which is more than enough for simultaneous 4K streaming, big file transfers or lag-free gaming — even when multiple users are online. That's an exceptionally consistent throughput!
After wired connectivity? The BE770 includes both a 10 Gbps WAN and a 10 Gbps LAN port, plus four 1 Gbps LAN ports and dual USB 3.0. That means you can hook up multi-gig internet, NAS drives or a wired gaming PC without ever worrying about creating a bottleneck.
You do miss out on a couple of extras. The BE770 doesn’t include mesh capabilities (look to something like the Netgear Orbi 870 if you want seamless roaming across huge homes), and it skips the gaming-specific features found on more expensive, specialized routers. But for anyone looking for a single, do-it-all router that nails the fundamentals — speed, coverage and plenty of wired options — the TP-Link Archer BE770 is the practical, future-proof choice.
- Read our full Asus RT-BE96U review
Best budget Wi-Fi router

The TP-Link Archer BE3600 is a dual-band Wi-Fi 7 router that’s incredibly wallet-friendly and often available for just $100. Even at its full $129 price, it offers remarkable value by including almost all of Wi-Fi 7’s best features. The only major thing missing is support for the dedicated 6 GHz band, but for those upgrading from an older Wi-Fi router or who no longer want to rent one from their ISP, the performance difference with the Archer BE3600 will be immediately noticeable.
Despite its budget price, the Archer BE3600 held its own when Brian put it through our real-world testing in his home. Even without the 6 GHz band, it still managed to reach a max download speed of 1.38 Gbps at close range (15 feet).
What really surprised Brian, however, was its sustained performance at long range. It reached over 700 Mbps at 50 feet and at 75 feet, it still hit 205 Mbps. That long-range achievement handily beat the more expensive TP-Link Archer GE800 gaming router, which clocked in at 355 Mbps and 91.5 Mbps in those same 50- and 75-foot tests, proving its surprising reach.
In terms of design, the Archer BE3600 is a rectangular router with a plain, all-black look and four repositionable antennas on the back. It features a nice selection of ports, including a 2.5 GbE input port, a 2.5 GbE output port, three gigabit Ethernet ports, and a USB port, alongside physical buttons for power and settings.
Buying your own networking equipment might seem expensive at first, but the BE3600 is proof that it doesn't have to be. The TP-Link Archer BE3600 is easy to recommend for anyone who wants the latest Wi-Fi spec without needing the fastest, most premium router available.
- Read our full TP-Link Archer BE3600 review
Best mesh Wi-Fi system

To this day, the Asus ZenWiFi BQ16 Pro still sets the bar for reliability in a Wi-Fi 7 mesh system, combining top-tier throughput with a setup process so seamless that our tester, Brian, had the entire network running and optimized in under eight minutes. After several weeks of daily use, it delivered consistently strong speeds and never left us fiddling with settings or chasing dropped devices — a huge relief for anyone tired of network headaches.
There's a reason why it's one of the best mesh Wi-Fi systems. In our lab and real-world scenarios, the BQ16 Pro posted standout numbers. At 15 feet, we measured wireless throughput at 2.629 Gbps, and it maintained impressive stability even as we moved farther away. That kind of sustained output means video calls and streaming sessions stay smooth, even with multiple people online at once. Exactly what you'd want in a mesh Wi-Fi system.
Under the hood, its quad-band layout (two 6GHz, one 5GHz, one 2.4GHz) gives each device more breathing room and minimizes bottlenecks during heavy use. For families or shared homes packed with smart devices, this design is a real advantage over traditional dual-band models that can become congested.
That said, it’s worth noting that this mesh kit remains one of the priciest on the market. And while coverage is strong, you may still need an extra node for truly sprawling or tricky homes — something to keep in mind if you’re replacing an older multi-unit system.
For buyers who’d rather not play network admin and want peace of mind, the BQ16 Pro’s three-year hardware warranty and lifetime support sweeten the deal. If you prioritize stability, easy setup and a network that "just works," the ZenWiFi BQ16 Pro is an investment you won’t regret.
- Read our full Asus ZenWiFi BQ16 Pro review
Best Wi-Fi router for long range

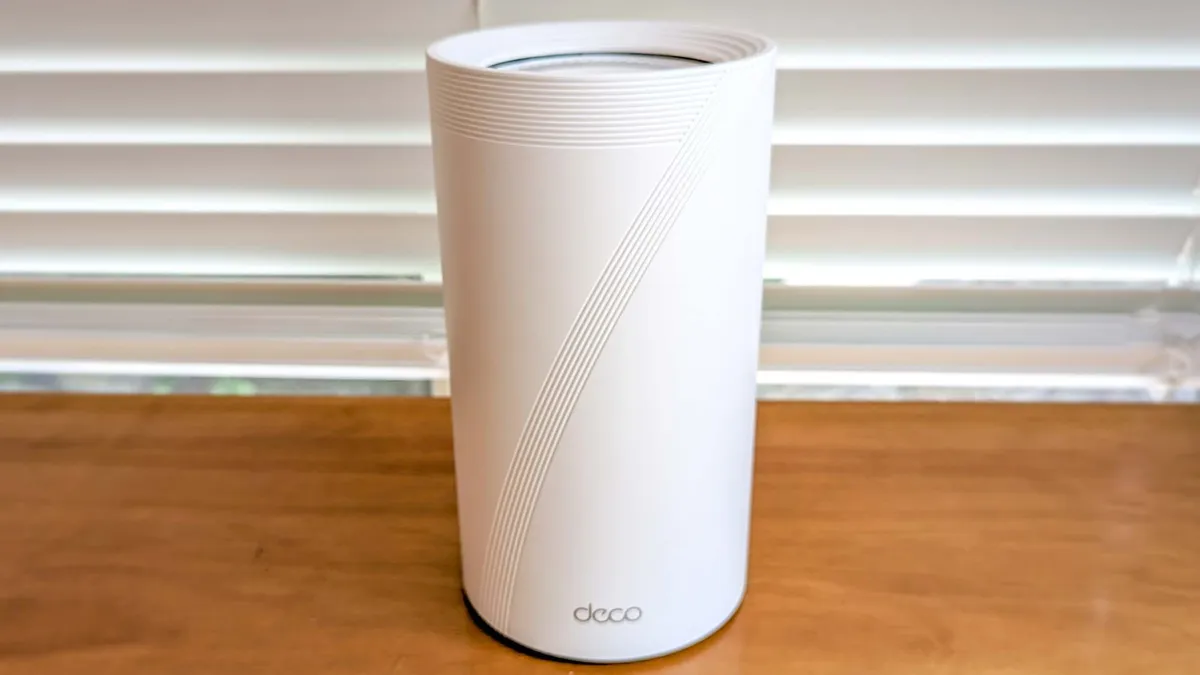
The TP-Link Deco BE65-Outdoor offers up outstanding Wi-Fi coverage as a standard Wi-Fi 7 router, delivering a measured maximum range of 150 feet that puts it at the top of our test results for reach. If your priority is filling every corner of your home or backyard with a reliable wireless signal, this is the router to watch — no mesh system needed.
And numbers back up the promise. In our real-world testing, the BE65-Outdoor sustained 693.6 Mbps at 50 feet and an impressive 635.4 Mbps even at 75 feet in wireless mode. That means you can stream, video call or game in rooms or outdoor areas most routers struggle to reach, and do so without the frustrating drop-offs that plague lesser models.
Future-proofing is built in, too. With support for Wi-Fi 7 and a pair of 2.5 Gbps Ethernet ports, you’re covered for both the latest wireless devices and wired backhaul, so you can add switches or hard-wire distant gear as your home network grows. That’s a real bonus for buyers who want to keep their options open as internet plans get faster.
Setup does have its quirks. Physically mounting the BE65-Outdoor can be awkward, as the included straps are on the chunky side, so we found that thinner cable ties worked better. Its cylindrical shape also stands out more than some sleeker competitors, and you don’t get integrated smart home features like Thread or Zigbee for the best smart home devices.
In our hands-on, adding the BE65-Outdoor as a wireless node just 25 feet beyond a stucco wall proved simple once in place, and the real-world coverage lived up to the lab numbers. If you need to fill a large home, backyard or even a detached garage with fast, steady Wi-Fi, this is the router we’d reach for first.
- Read our full TP Link Deco BE65-Outdoor review
Best Wi-Fi router for gamers

Asus couldn't make its ROG Rapture GT-BE1900AI look more like a gaming router even if it tried. And that's no bad thing, as this slick Wi-Fi 7 router is just about the most powerful we've ever tested, meaning this will put a smile on any gamer's face. Or anyone willing to part with $900 for the ultimate Wi-Fi connectivity experience.
If you're after lightning-quick download speeds, the ROG Rapture GT-BE1900AI has it. In our testing, it achieved an impressive 3.519 Gbps over a wired 15-foot connection, but going wireless is where things get interesting. This router boasted 2.580 Gbps of real-world throughput at 15 feet and 1.006 Gbps at 50 feet. So, whether you're using up bandwidth for lag-free gameplay across the house, while others are watching 8K videos or listening to music, this router has plenty of bandwidth and speed to go around.
This is a tri-band Wi-Fi 7 router with all the perks you'd expect, such as 2.4, 5 and 6 GHz data, along with dual 10Gbps ports (one dedicated specifically for gaming) and four 2.5Gbps ports. Plus, it even runs its AI engine, with 7.9 TOPS (trillions of operations per second), 4GB of RAM and 32GB of storage to run machine learning models and automatic game-boosting features.
The problem is just how pricey it is for it all. Not just the price tag, but also the 26.0 watts of power it hogs, leading to a spike in annual electricity bills (around $33). But if you're after the ultimate connectivity around your home, then the ROG Rapture GT-BE1900AI is well worth the money.
- Read our full Asus ROG Rapture GT-BE19000AI review
Best budget gaming Wi-Fi router

The TP-Link Archer GE650 is an affordable, feature-packed Wi-Fi 7 router that delivers excellent performance. While it is aimed at gaming, that doesn't stop it from being a fantastic choice for any kind of household. At just $350, it’s an absolute bang for your buck, offering full Wi-Fi 7 support, a low-latency design, multiple multi-gig ports and built-in RGB lighting.
Compared to its larger and more expensive sibling, the Archer GE800, the GE650 is an absolute steal, delivering faster speeds up close where they matter most for gaming, all at a lower entry price.
During his real-world testing, Brian was particularly impressed by the sheer performance of the Archer GE650 at close range. It reached a max speed of just over 2 Gbps at 15 feet, successfully outperforming its more expensive sibling. This strong trend continued at 50 and 75 feet, where it maintained speeds of 552.5 Mbps and 238.2 Mbps, respectively.
While there was a significant drop-off in performance at 90 feet (meaning the GE650 couldn't quite fill Brian’s whole house), limited range isn’t a deal-breaker, as serious gamers will likely use a hardwired connection anyway for the lowest latency and best overall performance.
Compared to the Archer GE800 with its larger footprint and winged design, the Archer GE650’s triangular shape feels like a breath of fresh air. The RGB lighting extends up the center of the front panel. Around back, you get a powerful set of multi-gig ports: a 5 GbE input port, a 5 GbE output port, three 2.5 GbE output ports (one of which is designated as the dedicated gaming port) and a USB port. Finally, the router comes loaded with TP-Link’s Game Center dashboard, where you can boost network performance in certain games, change the RGB settings, and monitor traffic.
If you’ve always wanted one of the best gaming routers but were deterred by the high price, the TP-Link Archer GE650 delivers that same functionality and look for much less.
- Read our full TP-Link Archer GE650 review
Best mesh router for large homes

The Netgear Orbi 870 is a full Wi-Fi 7 mesh system that can fill the largest homes with a strong wireless signal, covering up to 9,000 square feet with a three-pack. While its $1,000+ price tag is a significant investment, it sits right between the top-tier Orbi 970 and the more affordable Orbi 770. For this guide, I chose the Orbi 870 because it strikes the ideal balance between sheer performance and features.
During Brian’s real-world testing, the Orbi 870 managed to hit a download speed of 1.82 Gbps at close range (15 feet), placing it squarely between the Orbi 770 (1.7 Gbps) and the flagship Orbi 970 (2 Gbps) at that same distance.
What truly stood out, however, was its handling of middle and long distances. The system maintained a consistent speed of 628 Mbps at both 50 and 75 feet. Even at the edge, the Orbi 870 still delivered just over 100 Mbps at 90 feet, with a maximum recorded range of 115 feet overall.
The Orbi 870 also benefits from Netgear’s updated design, featuring elegant, sculpted towers instead of the wider, low-profile, wedge-like shape of past models (like the Orbi RBKE963). Functionally, the system maintains the classic Orbi layout: one unit acts as the dedicated router and the others are satellites. The router provides a powerful wired main connection with a 10 GbE input and four 2.5 GbE output ports. The satellites offer the same four 2.5 GbE ports for hard-wired devices.
If you have the budget and a large home that demands a fast, reliable, and full Wi-Fi 7 mesh system, the Orbi 870 is a compelling choice.
- Read our full Netgear Orbi 870 review
Performance results compred
At Tom's Guide, we test every Wi-Fi router in real-world scenarios to measure each of their download speeds at various ranges, including 15, 50, 75 and 90 feet. Not only does this let us know how well they perform, but it gives you an idea of the speeds you can expect for the router you're shopping for.
Now, even though one Wi-Fi router offers the fastest speeds at close range, doesn't mean it will beat the rest further away. It's a good idea to find the distance you'll most likely use your devices to help you decide the the best router for your space. Let's dive into the numbers.
Best Wi-Fi Routers Performance Results
Scroll through to see speed measurements at different distances
15 feet
| Product | Value |
|---|---|
| TP-Link Archer BE770 | 2.181 |
| TP-Link Archer BE3600 | 1.138 |
| Asus ZenWiFi BQ16 Pro | 2.62 |
| TP Link Deco BE65-Outdoor | 0.864 |
| Asus ROG Rapture GT-BE19000AI | 2.58 |
| TP-Link Archer GE650 | 2.109 |
| Netgear Orbi 370 | 1.074 |

Meet our testers

As someone who's been working from home for the past seven years, Anthony Spadafora has tried everything from Wi-Fi extenders to powerline adapters to get the most out of his home network before finally upgrading to a mesh Wi-Fi system. Along the way, he's tested out loads of different routers and network configurations. Based on what he's learned, Anthony tries to highlight the critical role Wi-Fi routers play in our day-to-day lives and how a mesh network can help solve the most common connectivity issues like Wi-Fi dead spots.

With experience in testing, using and evaluating wireless data from before Wi-Fi was even a word, Brian Nadel has tried out and reviewed every major router available in his home networking lab. A LAN nerd, his philosophy is to use the router the way you would, testing networking gear for ease of setup, performance, security and above all for value. The result is peace of mind when it comes to choosing the right router.
How to choose the best Wi-Fi router for you
If you’re buying your own Wi-Fi router for the first time, it can be difficult to narrow things down when you have so many options to pick from. Likewise, if you’re upgrading from an older Wi-Fi router, there’s still a lot you need to consider before making your final decision. To make things easier for you, I’ve narrowed down what factors you need to take into consideration before upgrading your home network.
By answering the three questions below, you’ll be in the perfect position to choose a new Wi-Fi router that makes full use of your current internet speeds, crushes dead zones in your home, and takes advantage of the latest wireless tech.
What's your internet speed?

Before buying a new Wi-Fi router, the first and most important step is finding out the internet speeds you're currently paying for and the actual speeds you're getting.
Even if you’re paying top dollar for the fastest plan available, your Wi-Fi router acts as a bottleneck. If your router is old or doesn't have the capacity for higher speeds, you won’t be able to utilize those faster download and upload speeds you’re paying for. Similarly, buying an expensive, overpowered router with only a basic internet plan is a waste since you won’t be able to take advantage of its faster speeds and extra features.
For the best experience, you want your router and internet speed to be a seamless match. However, if you plan to upgrade to a faster internet plan in the near future, you should consider buying a more powerful router now to future-proof your home network.
Currently, most cable internet providers offer plans that range from around 500 Mbps (Megabits per second) up to a full Gigabit (1,000 Mbps or 1 Gbps) or even higher at 2 Gbps. On the other hand, fiber internet providers offer plans that start at 1 Gbps and go as high as 5 Gbps or 10 Gbps.
Here’s how to find your actual speed:
- Check your advertised speed: Look at your monthly bill or service agreement. This document tells you the maximum speed your internet provider is supposed to deliver. Keep in mind that most plans are advertised as "up to" a certain speed, meaning your real-world speeds will often be slightly lower.
- Find your maximum wired speed: To do this, grab an Ethernet cable and plug your laptop or desktop directly into your router. Make sure you pause all other downloads or streaming on your network first, then run a few speed tests (using a reliable service like Ookla or Fast.com) to get the most accurate picture of the maximum speed your internet provider is actually delivering to your home.
- Map Your Wi-Fi Speed: From there, you can see if your router is creating a bottleneck. To do so, run multiple speed tests on your phone or tablet while connected to Wi-Fi, either in your browser or by using one of the best speed test apps. Be sure to move around your house or apartment and test in different rooms multiple times. This will give you a clear picture of how well your current Wi-Fi router spreads your internet throughout your home.
Now that you know your current internet speed, it's time to determine whether a traditional Wi-Fi router or a mesh Wi-Fi system is the better upgrade for your home network.
Router vs Mesh: What should I buy?

When upgrading your home network, you have two main choices — a traditional Wi-Fi router or one of the best mesh Wi-Fi systems. The right one for you is determined by the size of your home and the results of your Wi-Fi speed testing.
If you live in a small home or apartment, then a traditional Wi-Fi router should be able to fill your whole space with a strong Wi-Fi signal. I say "should" here because the placement of your Wi-Fi router plays a big role in its coverage. Ideally, you want your Wi-Fi router in the middle of your home and far away from large appliances, thick walls, and other obstacles that can interfere with its signal.
Unfortunately, router placement is often easier said than done, as it's determined by where the cable or fiber line comes into your home or apartment. You can always run an Ethernet cable from one of the best cable modems (or your Optical Network Terminal box if you have fiber) to your router if you want a more central location.
However, there’s another option that’s simpler and won’t have you tripping over cables.

Unlike a regular Wi-Fi router, a mesh Wi-Fi system is made up of multiple devices designed to carry your internet signal throughout your home in a more uniform manner. This is a key advantage: the placement of the main unit isn’t as critical. This is because, alongside it, you also have additional devices that act as satellites, which take the main unit’s signal and then distribute it through other parts of your home, either wirelessly or over a wired connection if your house is wired for Ethernet.
Besides the placement of your router, the main reason to choose a mesh Wi-Fi system over a standard Wi-Fi router is dead zones. Even the most powerful Wi-Fi routers can have trouble getting a strong signal to certain parts of your house, which is why those with multi-story or larger homes often go with a mesh system instead.
Deciding between a Wi-Fi router and a mesh router will come down to the size of your home or apartment and whether you currently have any dead zones where you just can’t get a connection. With that decision made, it’s time to determine which wireless standard is right for your new gear.
Do I need Wi-Fi 7?
Wi-Fi 7 is the latest wireless standard and it builds on previous ones by adding new features and capabilities designed to deliver a massive upgrade when it comes to download and upload speeds as well as reliability. If you’re shopping for a new Wi-Fi router or mesh router, it’s definitely worth spending a bit more on one with Wi-Fi 7 support to not only futureproof your home network but also to take advantage of its new features.
Wi-Fi 7's performance leap over previous generations like Wi-Fi 6 and Wi-Fi 6E comes down to three main upgrades that work together: wider data channels, the ability to use multiple wireless bands simultaneously and greater signal density.
With a wider channel, you’re able to move more data, which results in faster speeds. While 160 MHz channels were first introduced with Wi-Fi 5 and then greatly improved with Wi-Fi 6E, Wi-Fi 7 supports even wider 320 MHz channels. As a result, Wi-Fi 7 has a max theoretical speed of up to 46 Gbps.
If you’ve ever logged onto a Wi-Fi network and seen “2 GHz” or “5 GHz” at the end of its name, those numbers refer to wireless bands. Until Wi-Fi 6E introduced the new, faster 6 GHz band, you could only connect to one of these bands at a time. This changes with Wi-Fi 7's key feature: Multi-Link Operation (MLO). With one of the best Wi-Fi 7 routers and a Wi-Fi 7-equipped phone or laptop, you can connect to multiple bands simultaneously. Doing so results in faster speeds, better reliability, and lower latency overall.
In addition to wider data channels and being able to use multiple bands at the same time, Wi-Fi 7 also uses denser signals to carry more data in the form of 4K QAM (Quadrature Amplitude Modulation). With Wi-Fi 6 and 6E, there was only support for 1024-QAM, but by moving to 4K QAM instead, Wi-Fi 7 is 20% faster over the previous generation.
Although I wholeheartedly recommend upgrading to Wi-Fi 7, you can save some money and still get a very capable router or mesh router by going with one of the best Wi-Fi 6 routers instead. You’ll miss out on some features and faster speeds, but a router with Wi-Fi 6E support will still give you access to that faster 6 GHz band.
Speaking of that 6 GHz band, one thing to watch out for with Wi-Fi 7 is that not all routers that support this new standard give you access to all three bands (2.4, 5 and 6 GHz). To cut costs, some networking companies have begun selling cheaper, dual-band Wi-Fi 7 routers. They have most of Wi-Fi 7’s best features, but not all of them. Still, your budget can go a lot farther with a dual-band Wi-Fi 7 router, especially for mesh. Just be aware that if you forgo the 6 GHz band, you won’t see those blazing fast speeds like in our full test results.
Frequently Asked Questions

When should I replace my old Wi-Fi router?
A high-quality Wi-Fi router can last anywhere from three to five years. Power users—who rely on 4K streaming, online gaming, or many smart home devices—will want to upgrade closer to the three-year mark to stay current with the latest Wi-Fi generation (like Wi-Fi 7 now and eventually Wi-Fi 8). You can tell your router needs an upgrade when you experience frequent connectivity drops, slower speeds even with a fast internet plan, or constant problems that require a reboot. Finally, if your router is no longer supported by its manufacturer, it won’t receive critical security updates, leaving both it and all of your connected devices vulnerable to hackers.
Can I use my cable modem with my new Wi-Fi router?
Yes, you absolutely can. If you have a separate, standalone modem that connects your home to your ISP's line, you can plug any new Wi-Fi router into it, and it will work immediately. The one exception is if your internet provider gave you a single device that serves as both a modem and a router—often called a "gateway." You can still use this with your new Wi-Fi router, but you'll have to go into its settings first and activate bridge mode (or passthrough mode) to disable its built-in Wi-Fi functionality, as your new router will handle this task.
Where is the best place to put my Wi-Fi router?
Since Wi-Fi signals radiate outward in a 360-degree, sphere-like shape, the best place to put your router is in the most central location in your home. For the best coverage, you want it up high—like on a shelf or table—and out in the open. You don’t want any metal objects, large appliances (especially microwaves), mirrors, or large bodies of water (like a fish tank) nearby, as these can disrupt its signal and lead to interference.
What is a Wi-Fi extender and do I need one?
A Wi-Fi extender (also known as a booster or a repeater) is a separate device you plug into any outlet that takes the signal from your router and then rebroadcasts it in other areas of your home. This helps expand your router’s coverage, and they’re often recommended as an easy fix for dead zones. However, standard extenders can often cut your network speeds in half and may be more trouble than they’re worth. For slightly more money and much less hassle, a mesh Wi-Fi system is usually the better long-term upgrade. That said, one of the best Wi-Fi extenders still has its place in small homes or apartments where a mesh router would be overkill.
How we test the best Wi-Fi routers

To determine the best Wi-Fi routers, we subject them to a rigorous gauntlet of both real-world and benchmark testing: we accurately measure performance under both typical daily use and ideal testing conditions.
In our real-world tests, we set up each Wi-Fi router or mesh Wi-Fi system in a 100-year-old, multi-story home. This allows our expert team to test their ability to transmit data between floors and, critically, through walls. Throughout the review period, we use each router as our daily driver, pushing the limits with tasks like transferring large files, 4K video streaming, and competitive online gaming.
For our benchmark testing, we use Keysight’s IxChariot software to simulate complex network traffic in a repeatable and controlled way with 10 active users simultaneously. This lets us measure the quality and stability of a network powered by a Wi-Fi router or mesh router—including metrics like latency, jitter, and packet loss — rather than just peak download speeds. IxChariot then provides us with the key performance metrics that form the basis of the performance sections of our reviews and the testing data you see throughout this guide.
Finally, we test data transmission throughput at set distance intervals of 15, 50, 75 and 90 feet. This process gives us a clear idea of performance both up close and at a distance, and allows us to determine a router’s maximum effective range.
Since we use the same testing process for each router we review, we can then compare speed test results between models to tell you exactly why one router is better in certain situations and households than another.
For more information on how we test networking devices, check out our guide on how we test Wi-Fi routers, along with our more general how we test page for Tom's Guide.

