
 Club Benefits


Latest about Gaming

NYT Pips today hints and answers: Monday, June 22
Get clues and answers for today's NYT Pips to keep your streak going.

NYT Connections today hints and answers for Monday, June 22 #1,107
Get today's NYT Connections clues and answers for today's puzzle #1,107 on June 22.

The 6 best video games we've played in 2026 (so far) on PS5, Switch 2, PC and Xbox
It's already been an excellent year for new video games, and with 2026 at the halfway point, these are the best we've played so far.

'We wanted to have the same approach, but in reverse' — Control Resonant Creative Director details what to expect from the ambitious new game
We recently sat down with Control Resonant's Creative Director, Mikael Kasurinen, to discuss everything there is to know about the upcoming sequel.

Today's NYT Strands hints and answer: solutions to game #840, June 21
We help you find today's Strands answers with some useful hints and tips to win.

Today’s Wordle hints and answer: June 21, 2026, solution #1,828
Find out what today's Wordle hint and answer is and get some tips for it, plus see the solutions to previous games.

5 recently announced video games I’m most excited about, including a sequel I’ve been waiting 13 long years for
Here are five of my most anticipated video games announced or shown with new footage at the Xbox Showcase and Summer Game Fest.
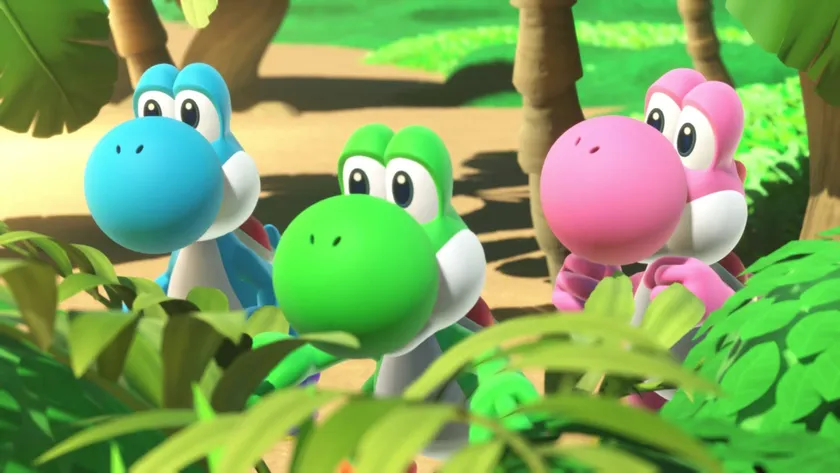
Yoshi and the Mysterious Book on Switch 2 is seriously charming, but also kind of boring
Yoshi and the Mysterious Book is a cute and colorful adventure for all ages, but it took its time getting me hooked.


